2021/11/10
RICOH MEG (magnetoencephalography) system
The “RICOH MEG” system measures small magnetic fields produced within regions of the brain, enabling the brain to be scanned and analyzed without pain or distress. While MRI measures the shape, MEG measures activity. This data is used to analyze the brain’s neural activity for use in medical fields such as neurology, neurosurgery, and psychiatry. The system supports medical care by providing a software that is optimized for scanning and analysis at clinics and hospitals. The system also supports medical research by being used in the elucidation of complex brain functions, and in other fields of applied research.
Release date: July 9, 2018
Product introduction page
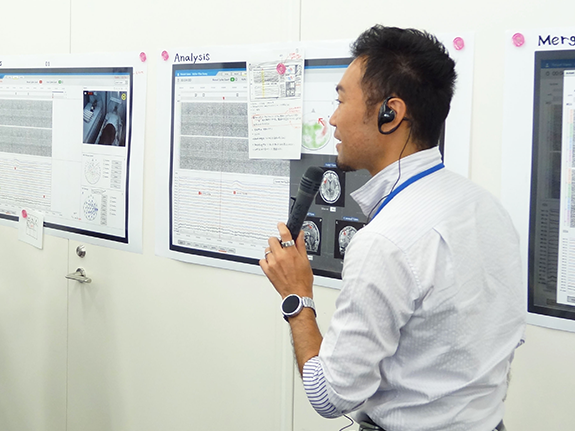
Designed to reduce burden of medical staff and enhance analysis efficiency
Previous models had different monitors for operation and displaying information. Operators had to move their eyes and heads to-and-fro, often ending up losing sight of the mouse pointer.
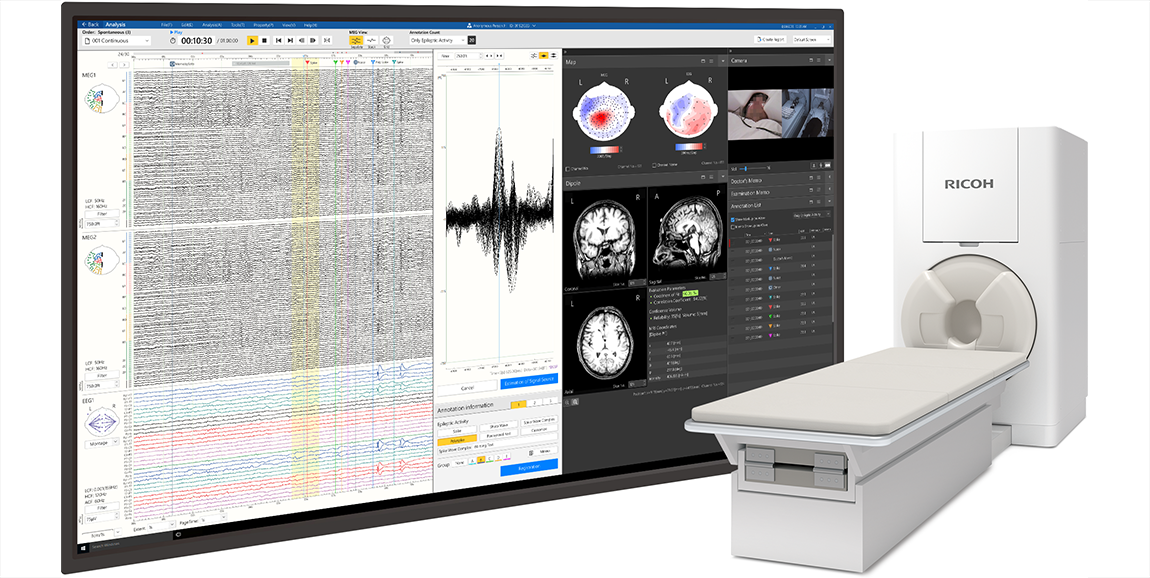
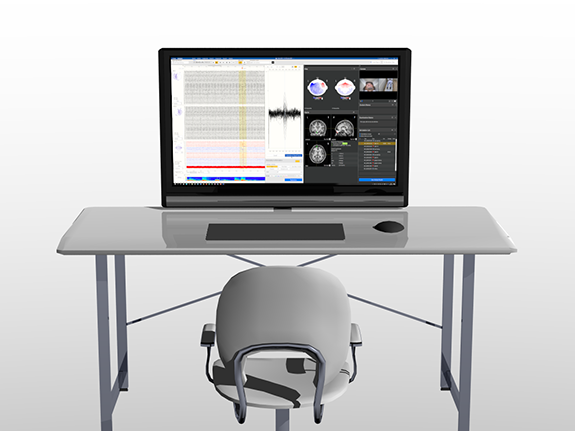
RICOH MEG’s analysis workstation has only one monitor. All operations and information are consolidated within the operator’s effective field of view, enabling the operator to grasp information instantly by moving his eyes. This reduces the physical burden on clinical laboratory staff.
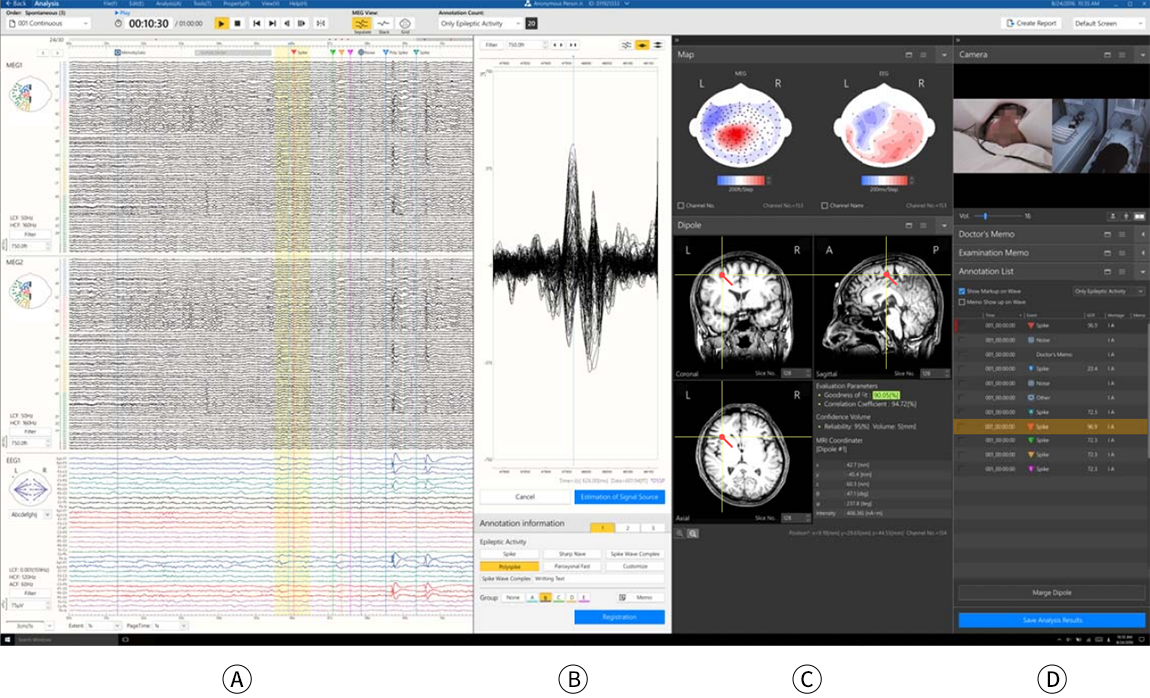
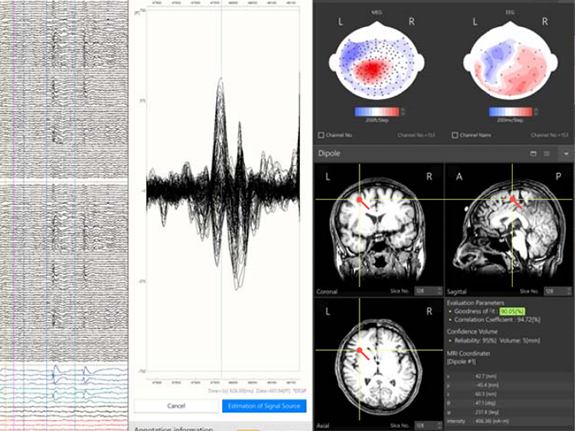
RICOH MEG’s screens are designed based on the process of how doctors and clinical laboratory staff come to make analytical and treatment decisions.
(A) shows magnetic field waveforms and brain waves over a period of time. If the operator is concerned about a certain part, he can click on that part to select it.
(B) then zooms in onto the selected part for more detailed analysis.
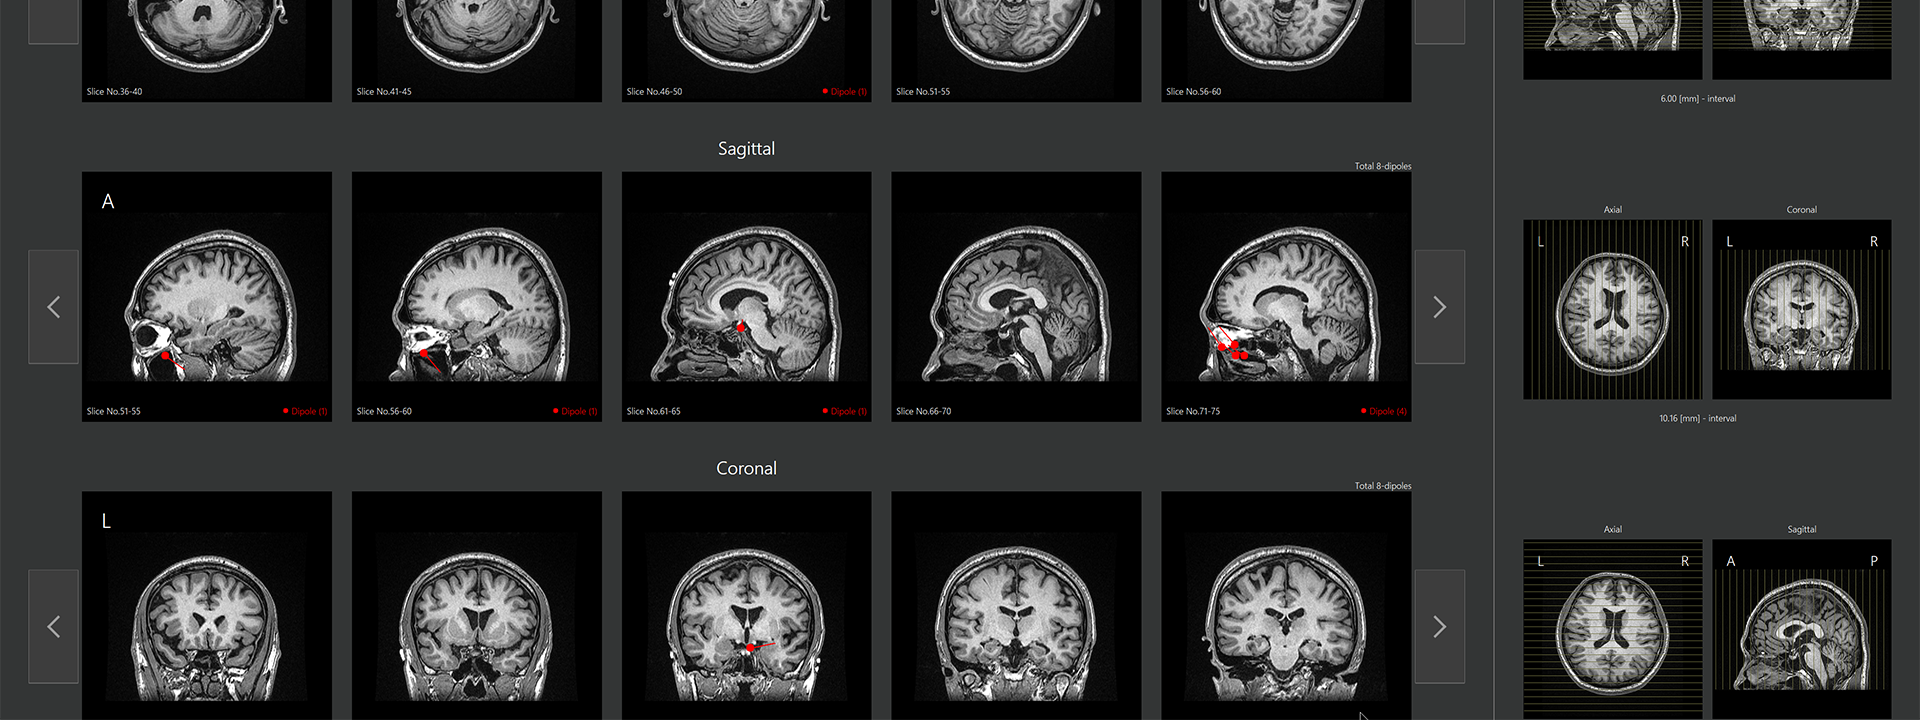
(C) displays the electro-magnetic activity during the selected time period as blue and red contour lines on an image of the brain. Activity source is displayed on the MRI image at the bottom.
(D) shows an image of the patient during that time period. A list of annotations and notes can also be displayed.
In RICOH MEG, the displays (A) to (D) are always linked. By selecting a waveform, brain activity at that point of time can be visualized from different perspectives. The display flows seamlessly from left to right, in the same direction as how thoughts flow in the mind of the doctor or clinical laboratory staff. These innovations reduce analysis time, and greatly improve the work efficiency of the operator.
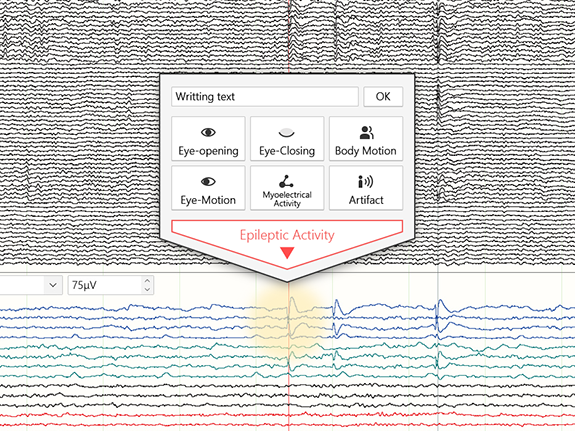
At clinics and hospitals, when clinical laboratory staff analyze brain activity waveforms and find something of concern, conventionally they will send written notes to the doctors.
With RICOH MEG, they can record notes and link the notes to the particular waveform with just a click. This enables quick and reliable communication of the scan data between medical staff.
Developing through trial and error
Ricoh entered the medical sector with the acquisition of Yokogawa Electric Corporation in 2016. At that time, we did not have any knowhow of medical and health care. Ricoh engineers did not have any experience in developing medical devices; we did not know what kinds of functions are needed for magnetoencephalography, nor what kinds of display are suitable for magnetoencephalograms.
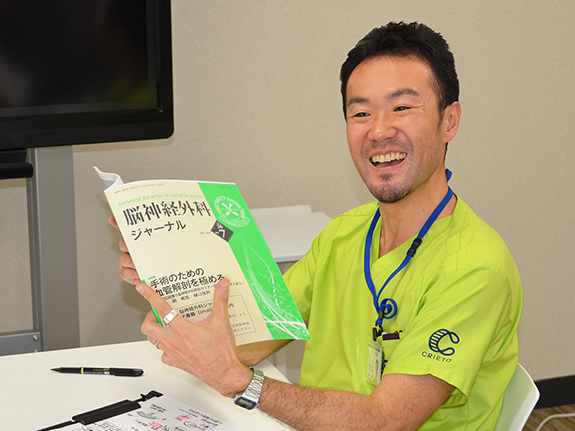
Michinari Shinohara, the designer put in charge, has a long career and a proven record for designing consumer and office products, but has never operated or looked closely at medical equipment. Even then, Shinohara looked forward to designing the MEG system. He recalled, “I have designed office products that contribute to our customers’ business. Now I can contribute to patients’ QOL through the design of medical equipment. I was excited about it.”
Shinohara was also in charge of planning this product, so he started by visiting clinics and hospitals and talking to the medical staff to learn about their needs. Cooperation of medical staff is essential to finding out what is really wanted, and making clear the challenges. Tohoku University Hospital, which cooperated with us, has a system called “Academic Science Unit” (*1), that supports the understanding and development of needs through on-site observations, by incorporating design thinking into medical care. This system matched what Ricoh wanted to do. Shinohara and Ricoh engineers participated in the system. This marked the start of a product development process using design thinking.
*1 Academic Science Unit (ASU): https://www.asu.crieto.hosp.tohoku.ac.jp/about/
Building relationship of trust with medical staff
In the beginning, communication with medical staff was not easy. “Doctors are very busy; you should not call them up all the time. At first I was worried about how we could build relationships with them,” said Shinohara.
To understand the situation in clinics and hospitals, and get ideas from visits and interviews, we first need to have the basic knowledge and information on that discipline. And so, we studied not only about medical equipment, but also about epilepsy, which is typically diagnosed using magnetoencephalography. By doing so, we were able to communicate smoothly with medical staff and built a relationship of trust.
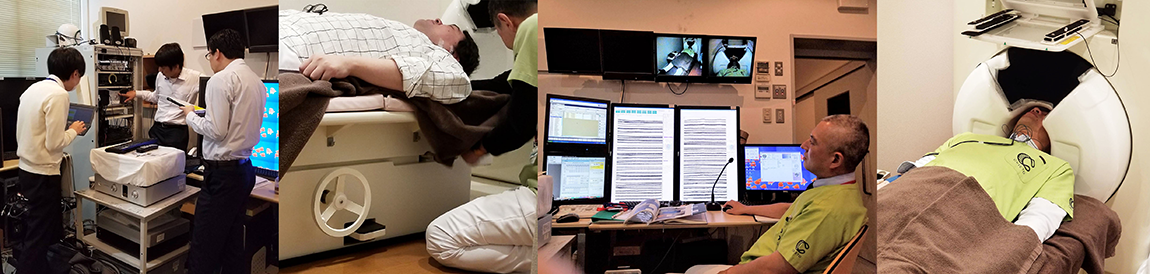
We also realized that in order to understand how medical staff feel, we need to stand in the position of the doctor and imagine how the doctor will actually use the equipment. By experiencing how such devices are operated and how the results are diagnosed, even becoming test subjects ourselves, we asked questions, presented hypotheses, and exchanged opinions with medical staff based on our experiences. However, we are not doctors. It is therefore important to ask whenever we have questions. If we had proceeded based on assumptions or suppositions, we would not have been able to gain the trust of medical staff actually using such devices.
Bringing the team together by identifying challenges
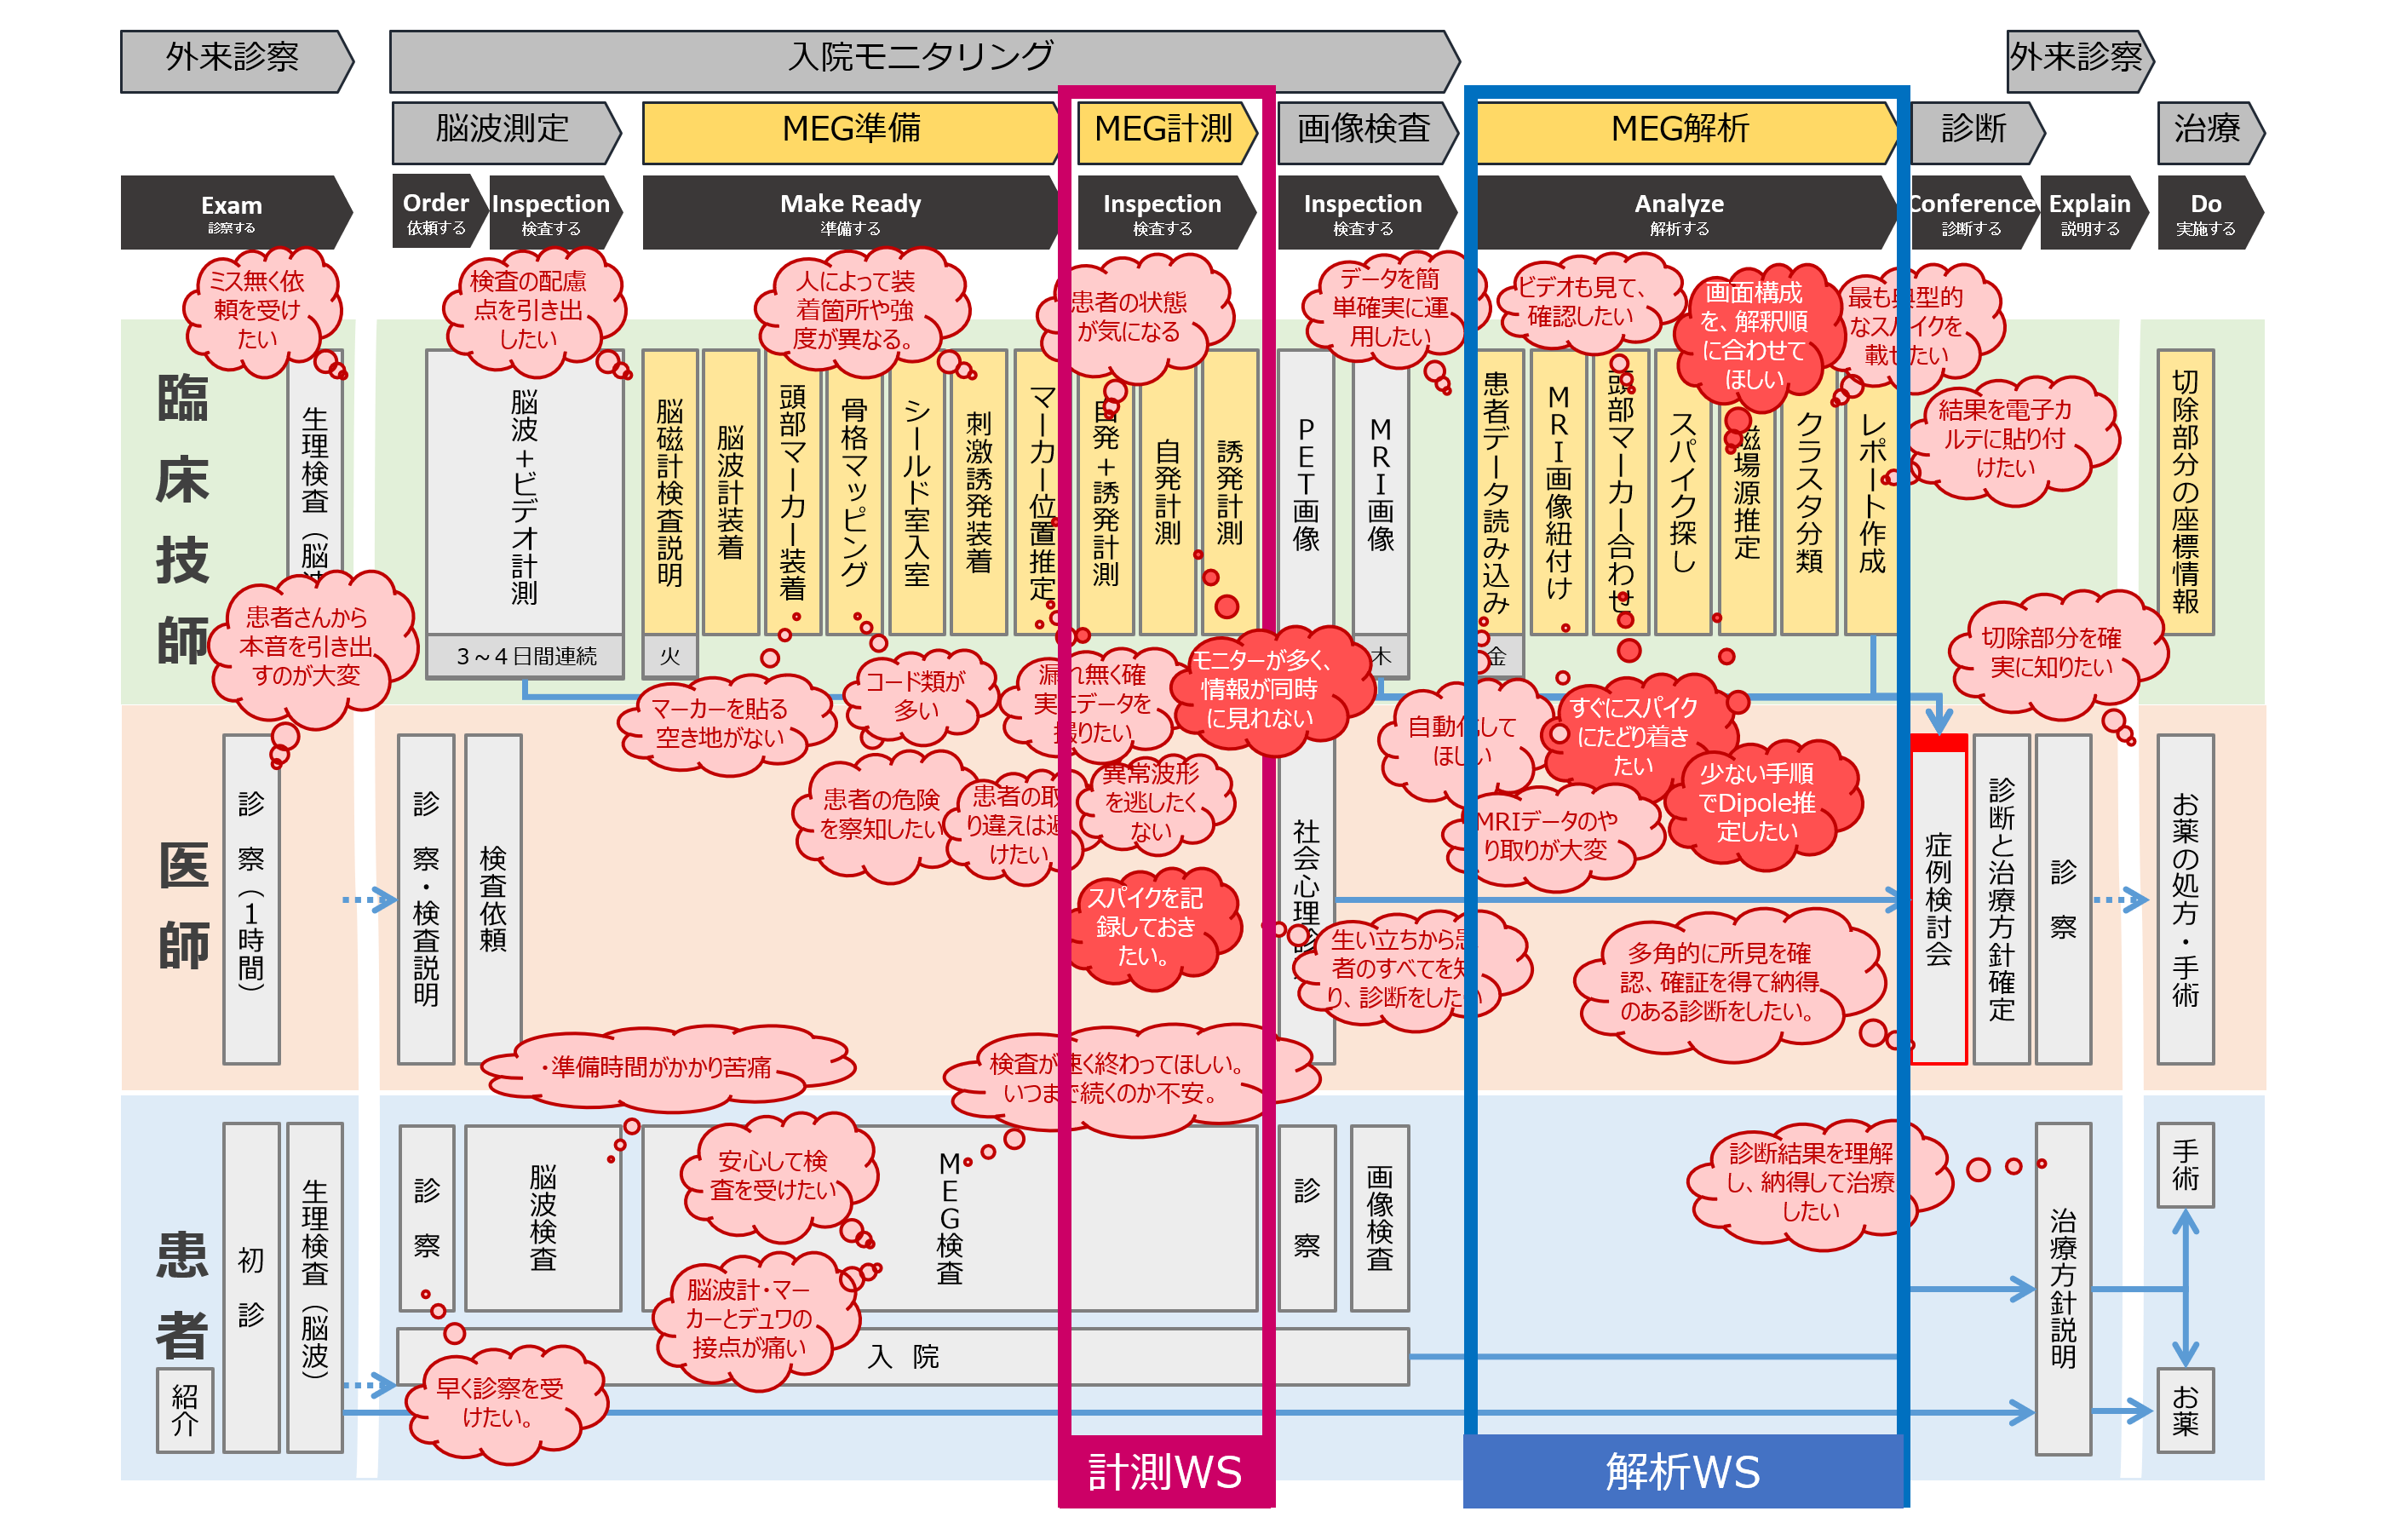
Based on the information gathered through visits and interviews, Shinohara held an in-house workshop to plot a customer journey map together with the engineers. Work processes and the division of roles were defined; thoughts of those involved, as well as hints, were added in the map. By co-creating a map that makes visible how the equipment is used in clinics and hospitals, likely “points of stress” are picked up and shared, and the challenges were identified. This makes it clear where we need to focus our efforts on. We were also able to gain opinions from the busy doctors on this journey map, thus facilitating smooth communication.
As the planner, Shinohara identified the issues that cause burden to medical staff. These were reflected in the planned specifications and also the design of the product.
Getting feedback from medical staff
The next step was to come up with ideas to solve the issues and give shape to those ideas. Here, Shinohara showed sketches to doctors and asked for their opinions.
“Because doctors are busy, we had limited time for communication. To get the most out of that short time, we used idea sketches in our discussions. By showing specific ideas visually, doctors were enthusiastic and gave us many helpful opinions. In this way, we learnt how we could effectively obtain feedback,” explained Shinohara.
Blending into the “culture” of clinics and hospitals
RICOH MEG has many details designed with medical staff in mind. For example, the waveforms are displayed against a white background. This white color is a natural white color closely resembling the color of paper. The color was chosen because, in the past, scan results were printed out onto paper for checking.
On the other hand, brain activity mapping and MRI images are displayed against a dark gray background. This color replicates the darkened room in which MRI images were viewed. It represents the situation whereby doctors viewed white colored brain images on the black background in a dimly lit room.
In this way, by taking into consideration how magnetoencephalography was done in the past, and the working environment that medical staff were familiar with, we designed a product that fits into the workplace.
Michinari Shinohara
UX designer
He has been involved in the design of more than
20 products and services, mainly for new
BtoB and BtoC projects.
He is also in charge of product planning for
UI/UX design in the healthcare field.